
- Parent Category: Power Systems
- Category: Optimal Relay Coordination Test Systems
- Hits: 14965
4-Bus System
I. Introduction:
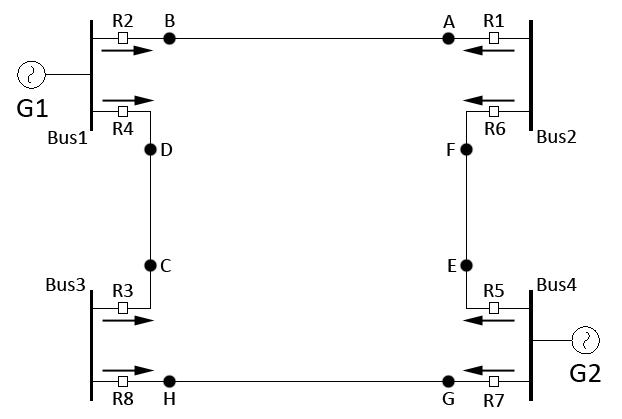
\(\bullet\) In this test system, both near-end and far-end \(3\phi\) fault locations are considered, as shown in the figure given below.
\(\bullet\) This network consists of 4 buses, 4 branches, and 8 directional overcurrent relays (DOCRs).
\(\bullet\) The objective function of this test system is mathematically expressed as follows:
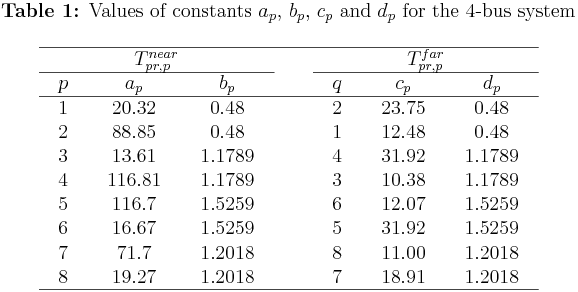
$$min \ Z=\sum^m_{p=1} T^{near}_{pr,p}+\sum^n_{q=1} T^{far}_{pr,q} \text{ ...... (1)}$$
where \(T^{near}_{pr,p}\) and \(T^{far}_{pr,q}\) are respectively the operating time of the primary relay at the near-end \(3\phi\) fault (at the \(p\)th location) and the far-end \(3\phi\) fault (at the \(q\)th location), which can be calculated as follows:
$$T^{near}_{pr,p}=TMS_p \left[\frac{\displaystyle \beta}{\displaystyle \left(\frac{\displaystyle a_p }{\displaystyle PS_p \times b_p}\right)^{\alpha}-1}\right] \text{ ...... (2)}$$
$$T^{far}_{pr,q}=TMS_q \left[\frac{\displaystyle \beta}{\displaystyle \left(\frac{\displaystyle c_p }{\displaystyle PS_q \times d_p}\right)^{\alpha}-1}\right] \text{ ...... (3)}$$
where:
\(\alpha\) and \(\beta\) are the time-current characteristic curve (TCCC) constants. For IDMT-based DOCRs, \(\alpha\) and \(\beta\) are equal to 0.14 and 0.02, respectively.
\(\bullet\) Note that the constants of \(T^{far}_{pr}\) in Eq.(3) are calculated in sequence of \(p\) instead of \(q\).
\(\bullet\) Also, these \(p\) and \(q\) notations are \(i\) and \(j\) in the original references. This replacement is necessary to avoid any confusion with other systems because the notations \(i\) and \(j\) are assigned for primary and backup relays, respectively.
\(\bullet\) The number of selectivity constraints depends on the network where only 9 selectivity constraints out of 16 are considered. This results in having a total number of 33 constraints.
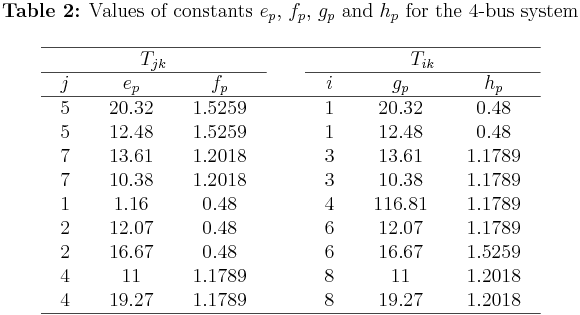
\(\bullet\) The selectivity constraint is mathematically expressed as follows:
$$T_{jk}-T_{ik}\geq CTI \text{ ...... (4)}$$
where \(T_{jk}\) and \(T_{ik}\) are respectively the operating times of the \(j\)th backup and \(i\)th primary relays for a \(3\phi\) fault occurs at the \(k\)th location. They can be computed by the following equations:
$$T_{jk} = TMS_j \left[\frac{\displaystyle \beta}{\displaystyle \left(\frac{\displaystyle e_p }{\displaystyle PS_j \times f_p}\right)^{\alpha}-1}\right] \text{ ...... (5)}$$
$$T_{ik} = TMS_i \left[\frac{\displaystyle \beta}{\displaystyle \left(\frac{\displaystyle g_p }{\displaystyle PS_i \times h_p}\right)^{\alpha}-1}\right] \text{ ...... (6)}$$
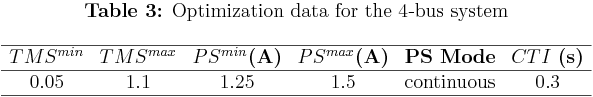
\(\bullet\) For this test system, the primary operating time of each relay \((T_i)\) should be bounded between the following lower and upper limits:
$$T^{min}(=0.05) \leq T \leq T^{max}(=1.0) \text{ ...... (7)}$$
\(\bullet\) Both plug-setting (\(PS\)) and time-multiplier setting (\(TMS\)) are considered as continuous independent variables. The CT rations (\(CTRs\)) for the relays \(R_1\) to \(R_8\), the listed primary/backup (P/B) relay pairs, and the corresponding \(3\phi\) fault currents available as \(\{a, b, c, d, e, f, g, h\}\) constants all are given below (click on them for bigger size):
II. Single-Line Diagram:
\(\bullet\) This single-line diagram was drawn by Ali R. Al-Roomi in Sept. 2013 and all the necessary data were coded in MATLAB m-files.
III. Files:
\(\bullet\) System DATA (MATLAB, m-file Format) [Download]
\(\bullet\) Results Tester (MATLAB, m-file Format) [Download]
IV. Citation Policy:
If you publish material based on databases obtained from this repository, then, in your acknowledgments, please note the assistance you received by using this repository. This will help others to obtain the same data sets and replicate your experiments. We suggest the following pseudo-APA reference format for referring to this repository:
Ali R. Al-Roomi (2015). Optimal Relay Coordination Test Systems Repository [https://www.al-roomi.org/coordination]. Halifax, Nova Scotia, Canada: Dalhousie University, Electrical and Computer Engineering.
Here is a BiBTeX citation as well:
@MISC{Al-Roomi2015,
author = {Ali R. Al-Roomi},
title = {{Optimal Relay Coordination Test Systems Repository}},
year = {2015},
address = {Halifax, Nova Scotia, Canada},
institution = {Dalhousie University, Electrical and Computer Engineering},
url = {https://www.al-roomi.org/coordination}
}
V. References:
[1] Ali R. Al-Roomi. Optimal Coordination of Power Protective Devices with Illustrative Examples. Hoboken, New Jersey: Wiley-IEEE Press, 2022.
