Online 2D & 3D Graph Visualizers
 Drop-Wave Function | http://www.Al-Roomi.org")
Hi Dears,
As you know, there are many \(1-,2-,\) and \(n-\)dimensional benchmark functions presented in this website. The current available JPEG graphs only show the \(3D, XY, XZ,\) and \(YZ\) views.
What if someone wants to visualize these graphs by rotating, zooming-in, zooming-out, changing the lower and upper bounds, varying the parameters, etc?!
Of course, he/she will need special software, such as MATLAB, Mathematica, Maple, Python, etc.
Again \(\rightarrow\) What if that person wants to do it directly! I mean online without using any software?!
We have embedded a huge number of pdf files that have controllable 3D plots (with .u3d objects), where the users have the ability to rotate, spin, pan, fly, zoom-in, zoom-out, cut specific planes, etc, as shown below for the Drop-Wave Benchmark Function:
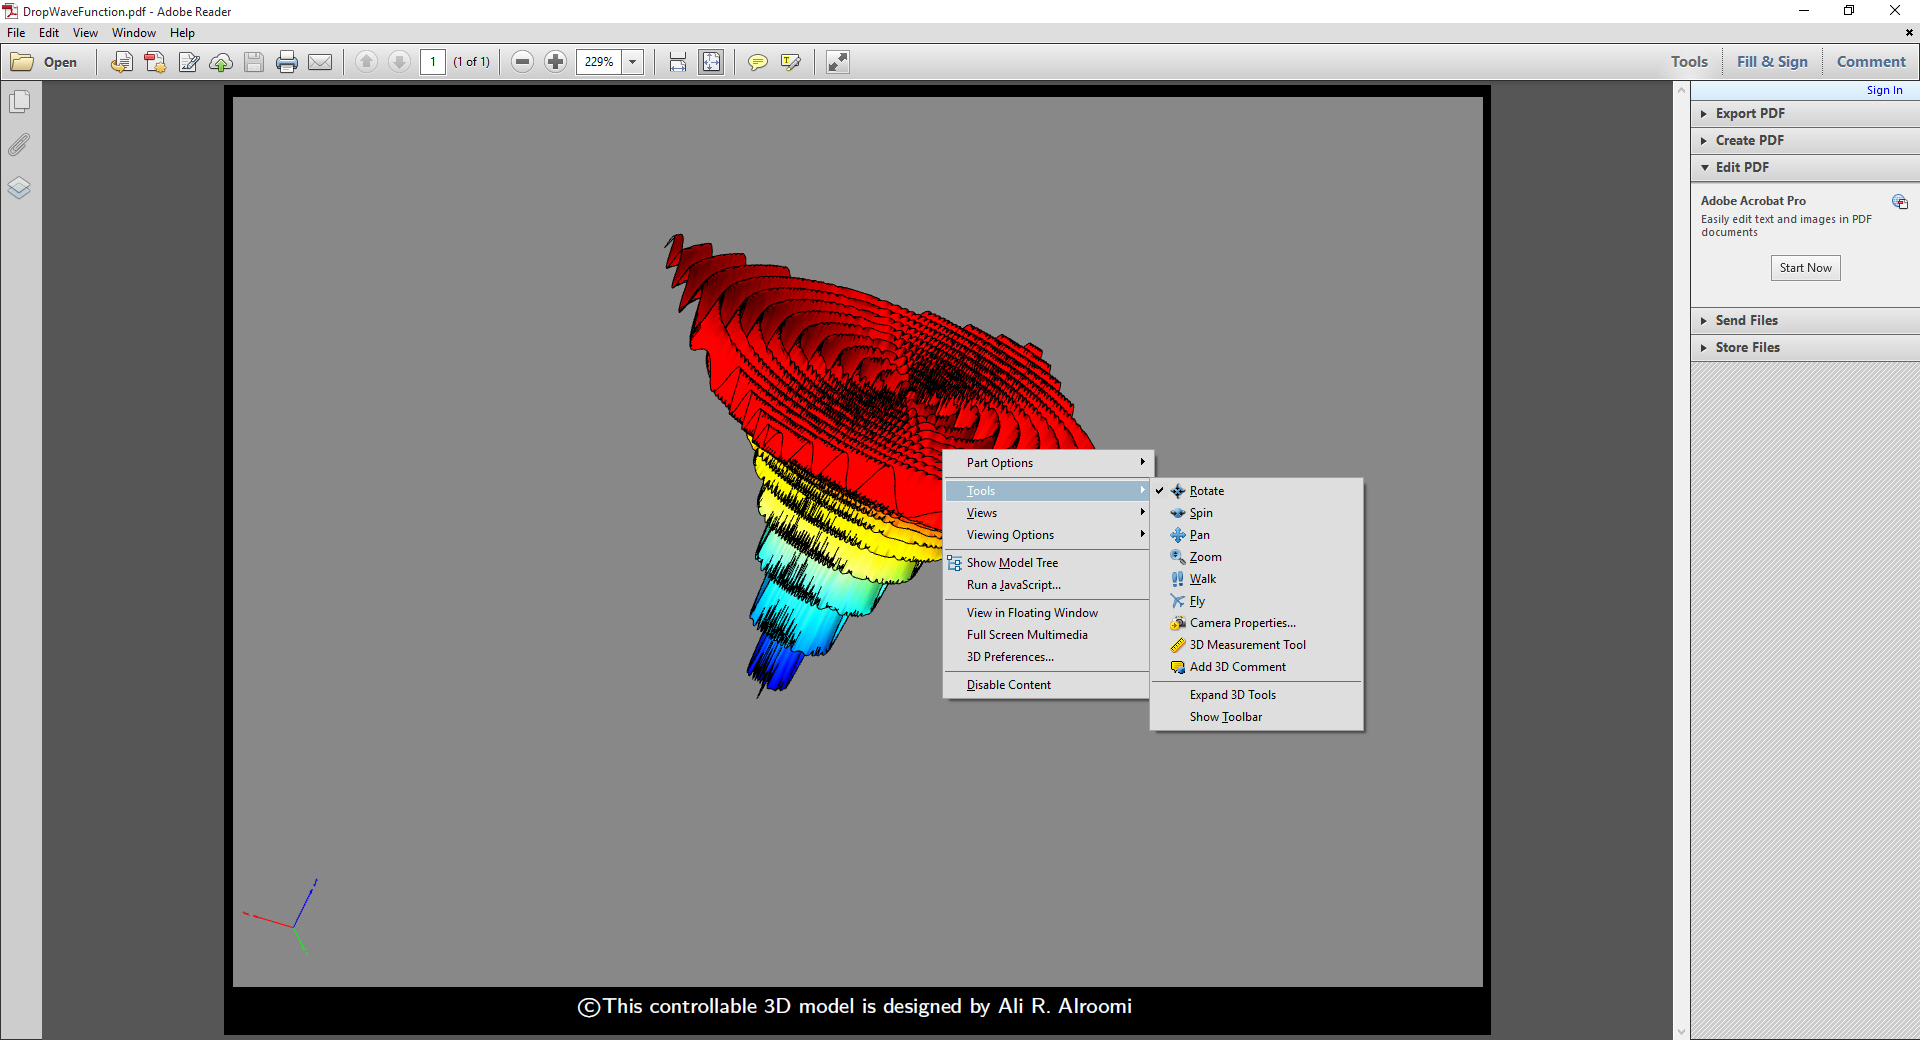
However, there are some technical limitations, such as the type and version of internet browsers, whether the browser's built-in pdf viewer feature is enabled or not, browsing from PC or smart device, etc. We will re-edit these articles to show only the links of these pdf files to anyone who wants to download them. But, keep in your mind that the 3D objects are only enabled in PCs.
What we want here is to talk about a newly activated service on this site. We have called it "Online Graph Visualizer" for \(2D\) and \(3D\) functions. These two visualizers can be easily used by clicking on the "Visualizers" button shown in the optimization menu on the left side of the website and then selecting either \(2D\) or \(3D\) visualizer.
We think that these two cool tools will help many of us to visualize any specific/arbitrary defined \(2D\) or \(3D\) mathematical functions.
Please note that these two tools are demo, and they could be modified - in the future - either by us or the original developers mentioned at the bottom of the corresponding pages.
Regards,
